Key Metrics
- Views: This metric represents the total number of times your demo has been viewed.
- Unique Visitors: The Unique Visitors metric indicates the number of distinct individuals who have viewed your demo.
- Completion Rate: This metric measures how engaging your demo is by showing the percentage of users who complete the entire demo. Lets say 100 unique visitors on the flow page. Out of this 30 watched all the steps. So completion rate is 30%.
- Play Completion Rate: This metric measures how engaging your demo is by showing the percentage of unique visitors who clicked on play button and also completed the entire flow. Let’s say 50 unique visitors, clicked on the
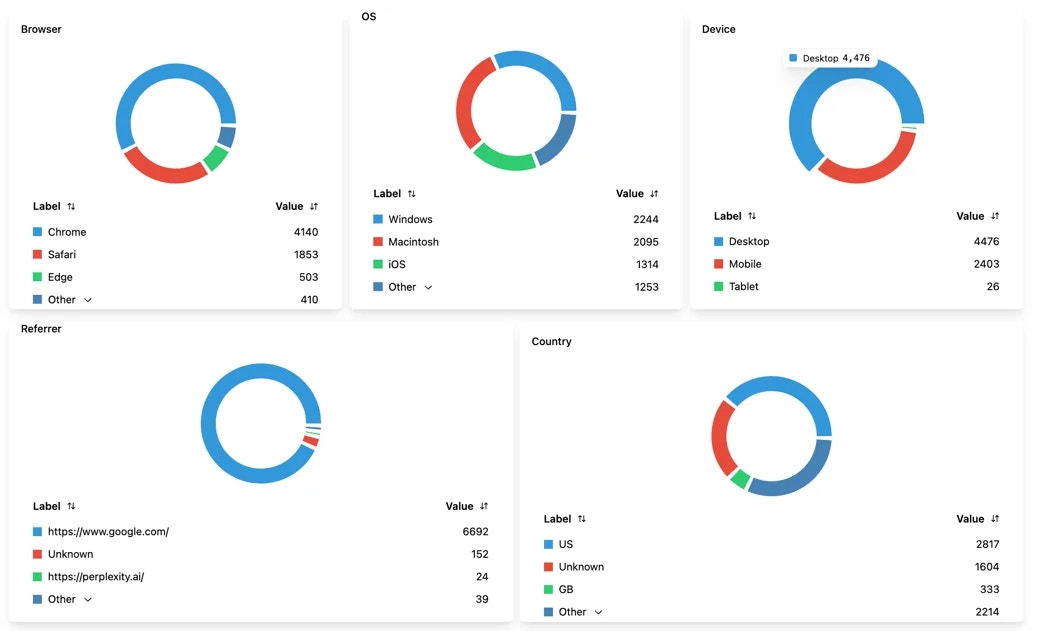
playbutton to start watching the flow and out of that 25 watched all the steps. So play completion rate will be 25/50 = 50% - Unique Visitors by Browser: Hexus Analytics provides a breakdown of unique visitors based on the web browser they use.
- Unique Visitors by OS: Similar to the browser breakdown, Hexus Analytics also shows the distribution of unique visitors across different operating systems.
- Engaged: Customers who have interacted with the demo, such as by clicking, playing, pausing, skipping, or completing any form actions (e.g., filling out fields or submitting forms).
- Leads: Customers who have provided their information by completing the forms within the flow, indicating a higher level of interest.
- Flow Trends Chart: A daily breakdown that tracks trends in unique visitors, CTA (call-to-action) conversions, and content views, offering insights into user activity and engagement over time.
- Ring Charts: Visual representations that provide a breakdown of unique visitors to a flow, segmented by factors such as country, browser, operating system, etc., offering a clear overview of the audience’s demographics and behavior.
What events can be propagated?
Most events that happen inside an Hexus can be propagated. Contact us at team@hexus.ai to enable the event propagation to your integrations. Here are some common events:Flow Rendered: Triggered when a Hexus is initially viewed.Hotspot Clicked: Triggered when a hotspot is clicked.Flow Ended: Triggered after a video step has completed.Flow Restarted: Triggered when a Hexus is replayed.Percentage Completed: Percentage of the flow completed by the userStep Reached: Triggered when the viewer navigates to a new step.Overlay Clicked: Triggered when the viewer clicks on a button within a Page overlay.External Url Clicked: Triggered when the viewer clicks on a URL within a hotspot or callout.CTA Clicked: A convenience “meta-event” that combines the two events above (Overlay Clicked,External Url Clicked).